What bird is that? Machine learning on audio data
To be honest I've never worked with audio data in a professional setting. During college you learn about spectrograms, how Fourier transforms work, maybe something on speech recognition, but that is where it stopped, at least for me. So I decided it was time to start a project where I use machine learning on audio data.
As someone who works with machine learning algorithms almost every day and tries to stay up to date with developments in research on this topic, I was surprised by how little I read about applications on audio data apart from research on speech recognition. Of course there is a lot of research on this topic, but somehow there is less attention for it than for other applications.
Most machine learning applications are applied on one of the following types of data:
- Numerical data
- Text
- Images
- Audio
Numerical data is easy, as algorithms expect numbers as input. So predicting the price of a house based on some indicators such as the number of rooms and size of the garden is relatively straightforward. When we turn to images, one would expect it to become a lot more difficult, but images are also just numbers. Depending on the color model that is used to encode the image, every pixel is represented by a few numbers. In the case of the well known RGB color model, there are 3 values (integers) between 0 and 255 describing the color (amount of red, green and blue) of every pixel as can be seen in the image below. This image of 7 by 7 pixels can be fully represented by 147 integers.
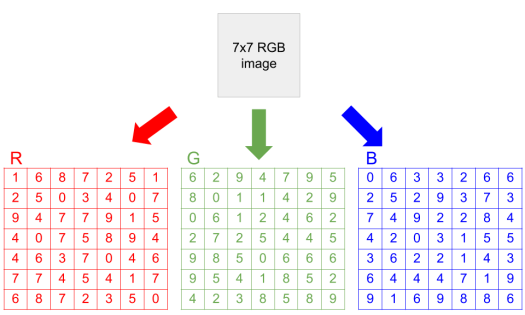
Image representation using the RGB color model (Source)
So whenever we want to use some algorithm to predict for instance the class of an image, we can flatten these 3 matrices and make a vector representation for an image. I should note here that flattening the input is only necessary for some algorithms or networks, while for instance Convolutional Neural Networks (CNNs) can deal with two or even three dimensional input data.
Text is the first kind of data that is not directly represented by numbers when you store it on a computer. Written text is just written text. There are multiple solutions to this problem, I will quickly explain two of them:
-
The first solution to this problem is using a Bag of Words (BoW) model, where each word is mapped to an integer. This is a relatively simple solution, where you only need to store a mapping from words to integers. This approach, however, has as downside that similar words do not have a similar representation.
-
That's why multiple researchers came up with the idea of learning a numerical vector representation for words that captures their meaning. Back in 2013, Mikilov and his colleagues introduced a very elegant solution called word2vec. In this framework, a model learns a vector representation of a word by looking at the words around it in a large database of text. Transforming every word into a numerical representation, also called a word embedding, allows us to get a numerical representation of a sentence by simply summing the vectors of all words in the sentence (although this is not the best method). This vector can in turn be used as input to an algorithm, for instance to predict the sentiment of a sentence or paragraph of text.
So far we have seen how we can numerically represent different kinds of data, as a numerical representation is often needed for machine learning algorithms. But what about sound? Sound is again by itself represented by numbers when we store it on a computer, just as we saw with images. For sound we also have discrete numbers, which represent the air pressure at different times during the audio recording. These numbers are called samples, and the number of these samples per second is called the sample rate. Apart from the sample rate, we also have the bitrate which tells you the number of bits (or the amount of data) the recording system can handle per second.
So when recording audio, a device called an analog to digital converter converts sound into an array of numbers that approximates the pressure wave of the sound over time. The most well-known visual representation of sound is called a waveform and it represents the amplitude (change in air pressure) over time. Where amplitude represents the loudness of a sound, its frequency, the number of oscillations per second, represents its pitch. Applying the Fourier transform to our array of numbers, gives us the frequency components present in this signal. I could try and explain how this works, but there is this youtube video by 3Blue1Brown that has a very intuitive explanation which I can't recommend enough. The frequencies found using Fourier analysis can be visualised in a spectrogram, which shows the spectrum of frequencies present in a signal.
Now that we have an idea of how audio data is digitally represented, let's experiment with some data. For this we use recordings of birdsongs, which you can download here. With the following piece of code, we can get the waveform and spectrogram of a randomly selected birdsong from the dataset.
import soundfile as sf
import matplotlib.pyplot as plt

#Load audio file
data, samplerate = sf.read("file_location")

#Plot the Waveform
plot = plt.plot(data)
plt.ylabel('Amplitude')
plt.xlabel('Time (sec)')
plt.show()

#Plot the Spectrogram
plt.specgram(data, Fs=samplerate)
plt.ylabel('Frequency (Hz)')
plt.xlabel('Time (sec)')
plt.show()
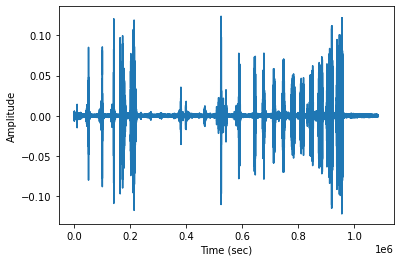
Waveform of a recording containing a birdsong
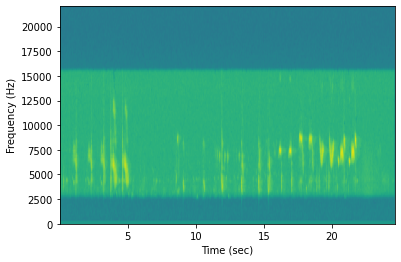
Spectrogram of a recording containing a birdsong
In the waveform we clearly see how the bird song contains parts with relatively large changes in air pressure and parts with no or very small changes in air pressure. In the spectrogram we see the different frequencies that are present in this birdsong. When inspecting different birdsongs, we clearly see large differences between these plots. This shows that we can not only hear differences, but also see them when we visually represent sound.
So far we have had a look at traditional ways of displaying audio data. A quick look at the leaderboards for machine learning competitions on audio data, learns us that something called a mel spectrogram is often used as input for classification algorithms. But what is this? It is a spectrogram, so it shows the spectrum of frequencies present in an audio signal. And the mel scale reflects how people perceive pitch. In the normal frequency spectrum an increase from 200 to 300 Hz is way clearer than an increase from 3000 to 3100 Hz. The mel scale fixes this problem, so it is a non-linear transformation that causes differences on the mel scale to reflect the differences in how we perceive pitch.
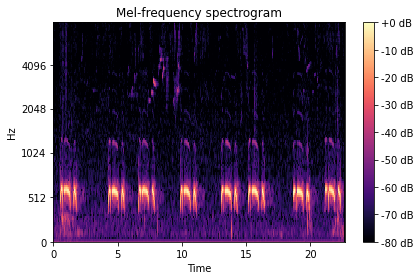
Mel spectrogram
The mel scale reflects how humans perceive pitch and dB is a scale of how humans perceive the loudness of sound. This might be the reason why mel spectrograms are often used for classification algorithms. Humans are very good at things such as speech recognition and, once trained, bird recognition. So based upon the data in a mel spectrogram, we would expect an algorithm to be able to also learn this.
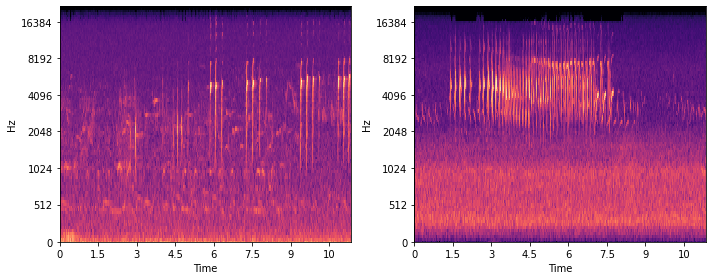
Below you find the mel spectrograms of two birdsongs, can you recognise which one is from a common blackbird? In the next blog post we will see whether a neural network can.
Mel spectrogram of two birdsongs